 Skip to content
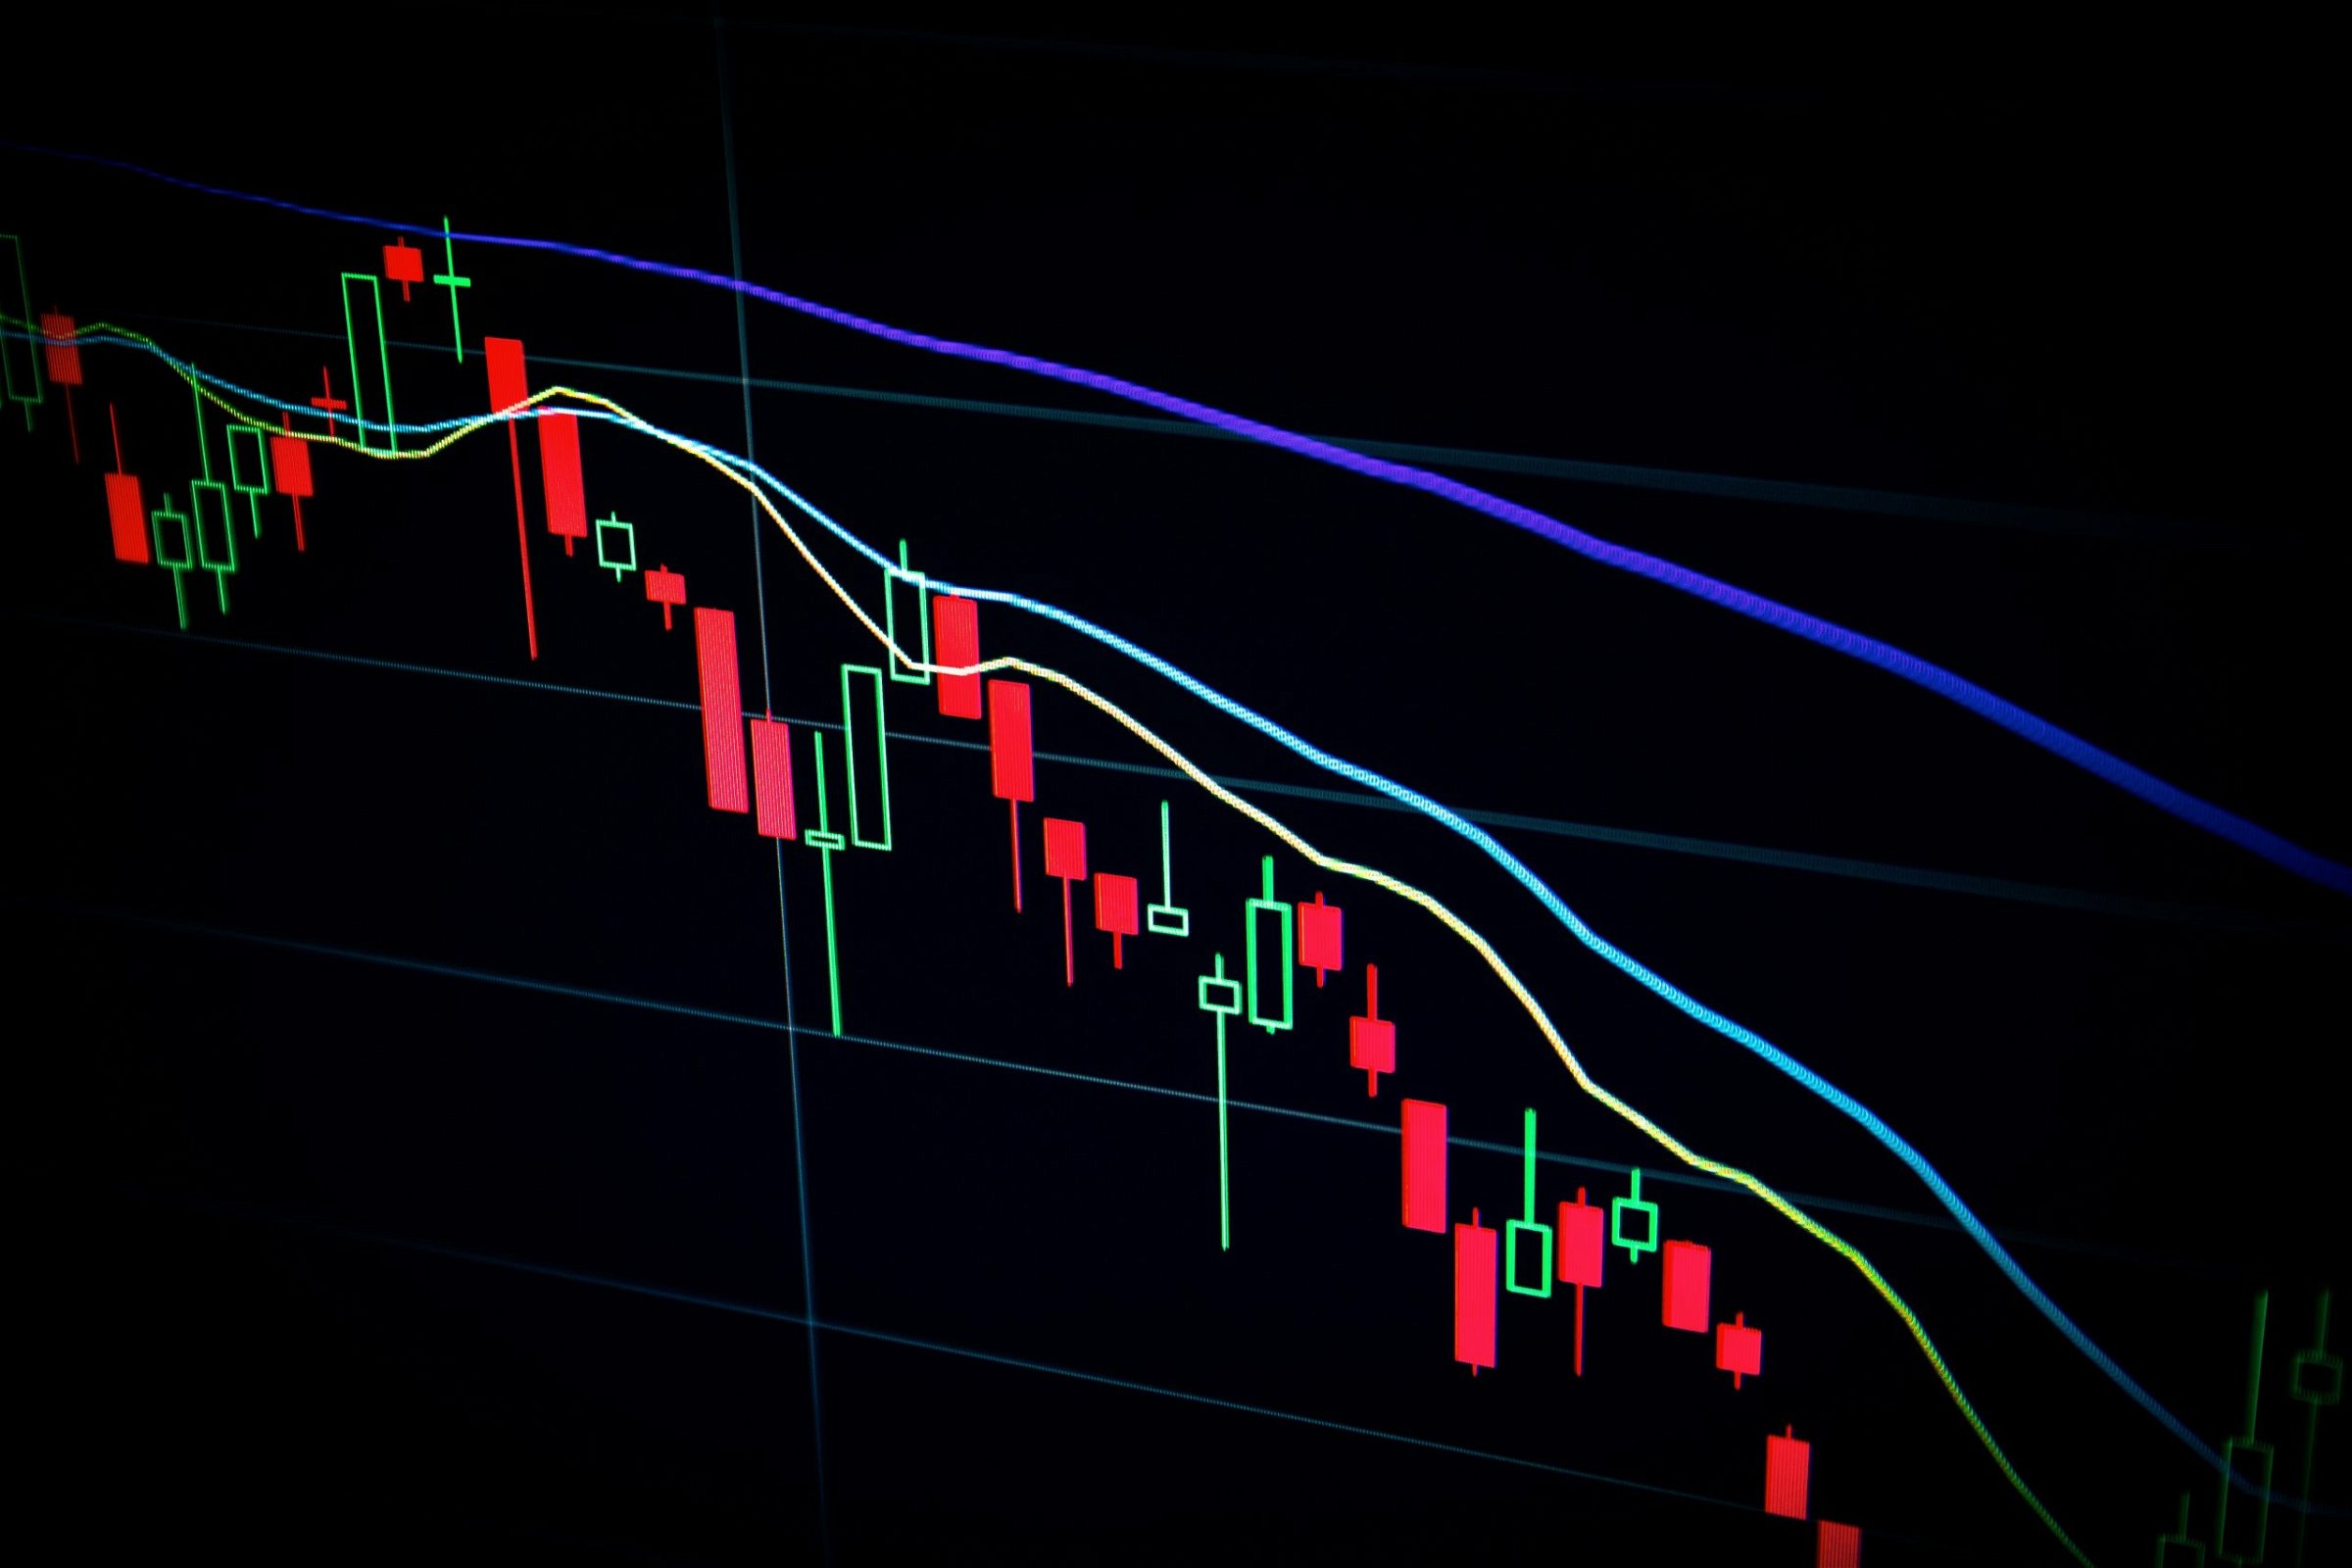
Are you inquisitive about stock markets?
Then I’m sure , that you would have stumbled upon the various graphs and charts.
These graphs or charts are called tools of Technical Analysis.
Technical analysis uses these charts along with statistical techniques to determine the expected future price and it’s movement.
Technical Analysis charts use historical prices and establish a ‘pattern’ of price movement on a graph.
These patterns of price movements help investors to determine a future price of the stock.
By determining the future prices, the investors make decisions of selling, buying or holding a stock.
Technical analysis just makes it easier for investors to predict and take proactive actions in most cases.
Investors have observed that candelstick charts show repetition of patterns over and again.
And hence making it likely and highly accurate to predict future prices.
These future prices determined by bar charts or candlestick charts are relied upon widely.
Coming to a quick introduction about candelstick charts, here’s what I found.
This dude from Japan named Munehisa Homma invented Candlestick charts to determine future prices of rice in the market.
As these charts were incredibly accurate, they were introduced to the world in a book named Japanese Candlestick Charting Techniques. This technique uses four prices to identify a pattern created to replicate it for future. (OHCL)
Open
High
Low
Close
You would now be wondering about the meaning of these terms by now.
For that, firstly you need to understand, what parts of a candle represent.
And here, it is being introduced to you in the most simplest way !
First things first.
This is how a candle looks like.
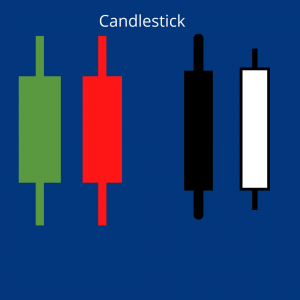
There are two colors.
Red and Green (or Black and white by some investors, depending on the software used. )
Red represents a bearish price movement (closing price is lower than opening price of the day)
Green represents a bullish price (closing price is higher than opening price of the day)
The rectangular box is called the ‘body’.
The thread like extension from top and/or bottom of the body is called ‘wick’ or ‘shadow’.
The wicks represent the high or low price point of the day.
Head or bottom of the body represent ‘opening price’ or ‘closing price’ depending on the price being in bearish or bullish movement.
In a bullish movement, the head (top) of the rectangular box would represent the closing price.
(Logic – In a bullish price movement – Closing price > Opening price ) , which in turn means, the lower side represents the opening price.
Here the body and wicks would be green in color.
In a bearish price movement, the head (top) of the rectangular box would represent the opening price.
(Logic – In a bearish price movement – Opening price > Closing price ) , which means, the lower side represents the closing price. Here the body and wicks would be red in color.
You would understand it much better with this simple pictorial representation.
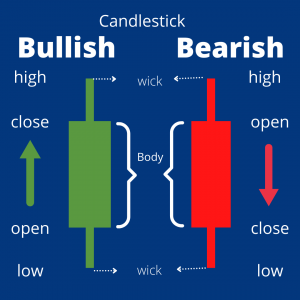
Simple, right?
It is simple yes. But there are 16 different kinds of candlesticks.
But understanding parts, price points and colors of a candlestick are the first principles.
Once you understand the above, you are free to choose the period of candlestick chart.
The time period depends on the objective of an investor.
His objective can be to hold the stock or buy/sell in short span.
On the basis of his strategy, he can choose the time for representation of candlestick chart.
It can be as short as minutes or hours in case of same day trading.
Or the time period may vary anywhere between days/weeks/months or years.
One common doubt that many beginners have is this following question.
What does a candle with just one wick represent ?
A green (bullish) candle in this picture has,
No lower wick. Which means, the opening price is the low price of the period.
A red (bearish) candle with just the lower wick shows,
No upper wick. Meaning, opening price is the highest price of the period.
If you want to get better at reading candlestick charts, randomly pick candles from any chart and guess your answer about what are the four price points and its characteristics,
Its like going back to school and learning a new subject all together.
If you start enjoying the technical analysis of stock market, there is stopping you from predicting the patterns of the market.
There are different types of candlestick charts. To name the popular ones, Hammer candle, Shooting Candle and Doji Candle.
I believe a simple video explaining these would be much for understanding than a detailed article.
Subscribe to my YouTube channel to learn about many finance related topics in the most simpler manner.
Sandhya Pulaskar